The Consensus Map: What 167 Crypto Channels Actually Recommended in 30 Days
The Consensus Map: What 167 Crypto Channels Actually Recommended in 30 Days
If you watch crypto YouTube, you already have a feeling for what "everyone" is saying. Bitcoin is going up. XRP is about to move. Solana is undervalued. It feels like a consensus, because you hear it from many voices.
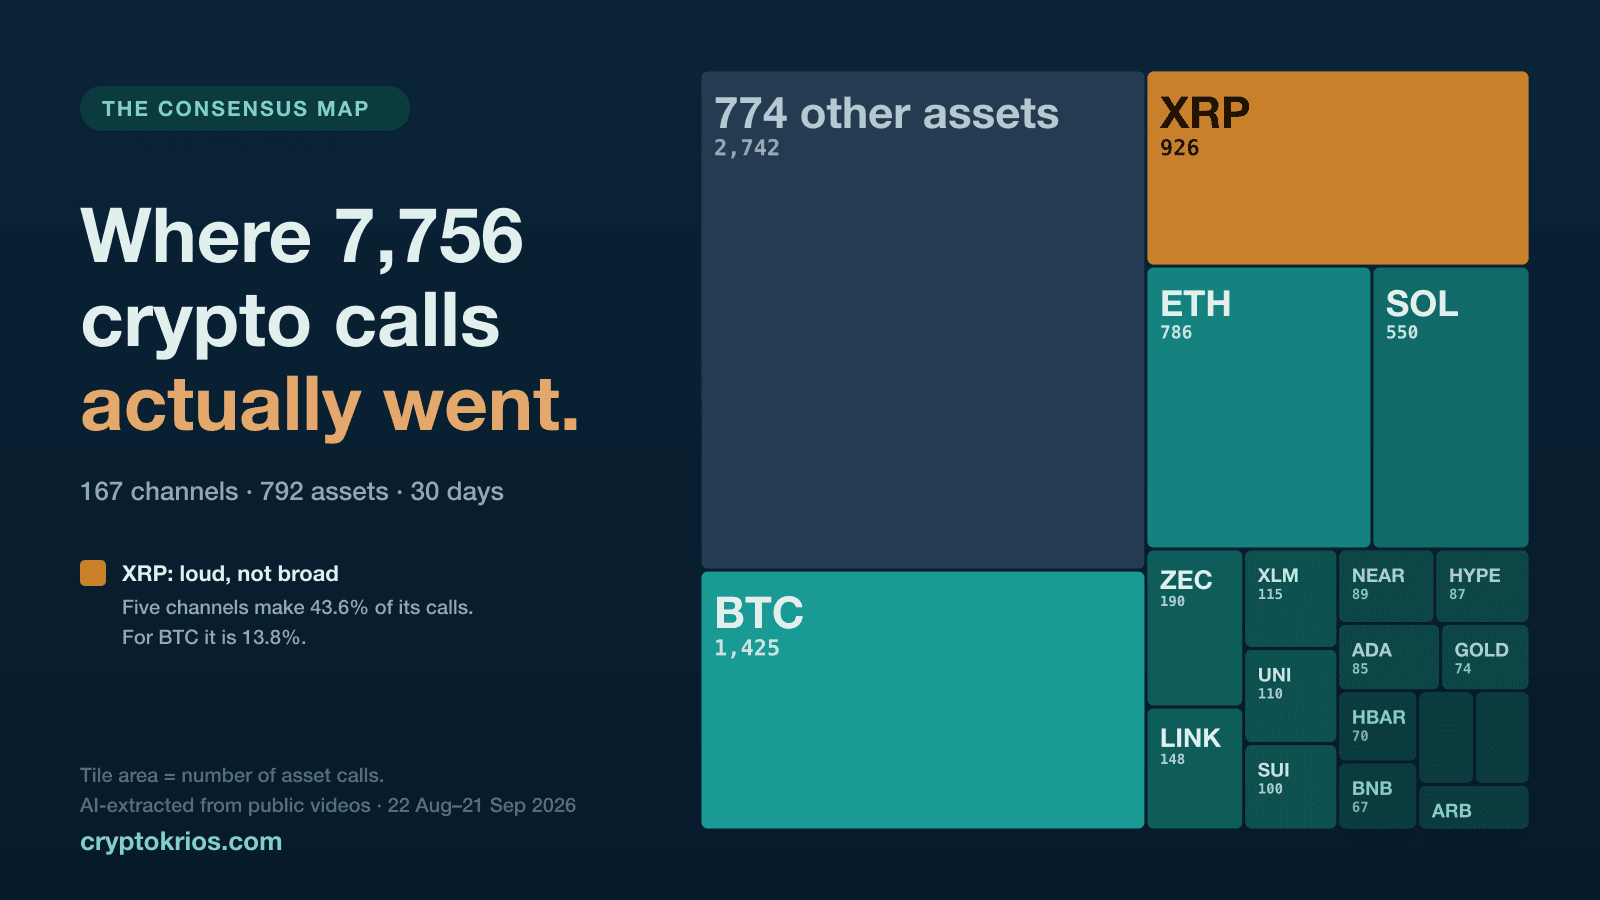
We decided to measure it. Over the 30 days from 22 August to 21 September 2026, our pipeline extracted 7,756 asset recommendations from 167 crypto YouTube channels, covering 792 different assets. For each one it recorded what was recommended and in which direction: bullish, neutral or bearish.
This article is a map of that corpus of crypto influencer recommendations: where the attention goes, how concentrated it is, how one-directional it is and, most importantly, what none of that can tell you. It is not a ranking of channels, it names no channel, and it says nothing about who is right. It describes the shape of what crypto influencers recommend, so you can read a single call against it.
How the map was built (and what it cannot see)
Every video we analyse goes through an AI reading of its content. When a creator recommends or discusses an asset, that mention is extracted as a record: the asset, a sentiment label (very bullish, bullish, neutral, bearish or very bearish), an extraction confidence, and a short explanation of the reasoning.
For this article we kept every record published between 22 August 2026 and 21 September 2026 at 20:00. To make sure every figure below agrees with every other one, we used fixed date bounds rather than a rolling window. "Bullish" means bullish plus very bullish; "bearish" means bearish plus very bearish.
Three things to keep in mind before the numbers:
- "Asset" is broader than "coin". Crypto channels also talk about gold, equities and ETFs, and those calls are in the data. Gold, for instance, appears 74 times across 38 channels.
- Sentiment is an AI reading of public content. It describes what a creator said, not what the price did afterwards, and it can be wrong on individual records. Across thousands of records, the errors matter far less than they do for any single one.
- This is one 30-day window. It is a snapshot, not a constant. We make no claim about the direction of the market in that period, because nothing here measures it.
Four assets take nearly half of everything said
Start with the concentration. Bitcoin, XRP, Ethereum and Solana account for 3,687 of the 7,756 calls, or 47.5%. Everything else, the other 788 assets, shares the remaining 4,069.
- Bitcoin: 1,425 calls
- XRP: 926 calls
- Ethereum: 786 calls
- Solana: 550 calls
After those four, the drop is steep. The fifth most discussed asset, Zcash, has 190 calls. Chainlink has 148, Stellar 115, Uniswap 110, Sui 100.
None of that is surprising in itself; attention follows market capitalisation. What is worth noticing is how quickly the map thins out. Only 89 of the 792 assets, 11.2%, were named ten times or more in a month, across 167 channels.
Broad versus loud: BTC and XRP are not the same kind of popular
"Most discussed" hides a difference that matters a great deal for how you should read a call. Compare the two biggest assets:
- Bitcoin: 1,425 calls from 144 channels, about 9.9 calls per channel. The five loudest channels on Bitcoin account for 13.8% of its calls.
- XRP: 926 calls from 69 channels, about 13.4 calls per channel. The five loudest channels on XRP account for 43.6% of its calls.
Bitcoin is discussed by 144 of the 167 channels, 86% of everything in the window. It is genuinely broad: take away the five loudest voices and almost nothing changes. XRP is discussed by 69 channels, 41%, and nearly half of the conversation comes from five of them. Ethereum (top-five share: 19.1%) and Solana (24.5%) sit in between.
That does not make XRP calls wrong. It makes them a different kind of evidence. A small group repeating a view many times is not the same object as a large number of independent channels each arriving at it separately. Both show up as "lots of calls" in a count. Only one of them is a crowd.
The same pattern appears lower down. Zcash has 190 calls from 66 channels, about 2.9 each: broad. Hedera has 70 calls from just 16 channels, about 4.4 each: a smaller room. This is why we look at the share of calls coming from the five loudest channels next to the raw count. Volume tells you how much was said, not how many people said it.
The long tail: 478 assets named exactly once
At the other end of the map are the assets almost nobody talks about. 478 of the 792 assets, 60.4%, were named exactly once in the 30 days. Another 225 (28.4%) were named between two and nine times. Only 89 reached ten or more.
A call on one of those 478 assets has a particular property: nobody else can confirm it. It might be early. It might be a single voice. It might be a small project with a big story attached to it. The map cannot tell you which. It can only tell you that you are on your own with that call, which is a different situation from agreeing with 144 other channels about Bitcoin.
Lonely is a fact about the call, not about the channel that made it. Plenty of good analysis starts as a lonely call. But a lonely call needs a stated reason, and the reason is the part worth checking.
The direction: 15.7 bullish calls for every bearish one
Now the direction. Of the 7,756 calls:
- 5,449 were bullish (70.3%)
- 1,960 were neutral (25.3%)
- 347 were bearish (4.5%)
That is 15.7 bullish calls for every bearish one. And 111 of the 167 channels made no bearish call at all in the window. Among the 94 channels with at least 20 calls, 49 never made one.
It is tempting to read that as an accusation. It is not, and the data explains why. We split the channels that have 20 or more calls and a trust score into two groups: the 34 where at least 30% of calls are neutral or bearish, and the 55 where fewer than 30% are. The first group averages a trust score of 7.79 (median 7.83). The second averages 7.59 (median 7.80). A gap of 0.2 points on a ten-point scale.
So channels that mix in neutral or bearish calls are not measurably more trustworthy than channels that do not. The problem is not honesty. The problem is contrast.
A "buy" from a channel that has not said "sell" in a month can be completely sincere, and it still tells you very little, because there is nothing to compare it against. You cannot tell a considered bullish view from a permanent one. When a channel has put bearish calls on the record, its bullish calls acquire information: it demonstrably can, and does, take the other side when it sees a reason.
What this map cannot tell you
We would rather be explicit about the limits than let the numbers do more work than they should.
It does not measure accuracy. The map says what was recommended and in which direction, not whether it was right. Accuracy is a separate question, and we cover it in our judged-predictions analysis: the best hit rate in our judged corpus is roughly one checkable call in three.
It does not measure market direction. A window in which prices rose or fell would produce a different sentiment mix. We make no claim about which one this was; the point here is the shape and the contrast, not the level.
It depends on extraction. An AI reading of a video can mislabel a neutral aside as a recommendation, or miss a hedge. Aggregates are more reliable than single records, and none of the figures here should be used to judge an individual creator.
Neutral is ambiguous. A neutral call may be a genuine "I am undecided", an explainer with no view, or a mention in passing. That is why the trust-score comparison above groups neutral and bearish together, and says so.
It is a snapshot. Thirty days, one moment. Re-run it in a different month and the ranking of assets will change, even if the shape (concentrated, thin at the tail, one-directional) proves stable.
Five questions to read a call against the map
You do not need a tool to use any of this. Run these on the next video you watch:
- Has this channel ever said "sell"? One bearish call in the last month is enough to give its buys some contrast.
- Is the asset one of the four, or one of the 478? Crowded calls need no courage; lonely calls need a reason. Ask for it.
- Count channels, not videos. Search the asset, filter to this week, and count the distinct channels. Five loud ones can fill a results page.
- What would make them wrong? A real call has an exit: a price, a level, a condition. No stated exit means no way to score it.
- By when? "Soon" can never be wrong. "By December" can.
Conclusion: read the shape before you read the call
Across 7,756 crypto influencer recommendations from 167 channels, the map is clear: attention is concentrated in four assets, thin almost everywhere else, and overwhelmingly in one direction. None of that is a verdict on any creator. Channels that keep both sides in view are no more trustworthy on average than those that do not, and bullish channels are not shills.
What it changes is how much weight a single call can carry. A "buy" on an asset four others also cover, from a channel that has never said "sell", is the cheapest kind of recommendation there is. A "buy" from a channel that has taken the other side, with a stated exit and a date, is the most expensive. Read the shape first, then the call.
Try CryptoKrios free to see the trust scores, the extracted calls and the checkable history behind each channel, so the map is something you can check rather than take on our word. https://cryptokrios.com/free
Trust scores and asset extractions are AI analyses of public content. They describe what was said, not what will happen. Nothing in this article is financial advice. Always do your own research.
Discover what crypto influencers really say
Get AI-verified analysis of top crypto content creators — free.
Try CryptoKrios FreeRelated Articles
The Checkability Gap: Why Most Crypto Calls Can Never Be Graded
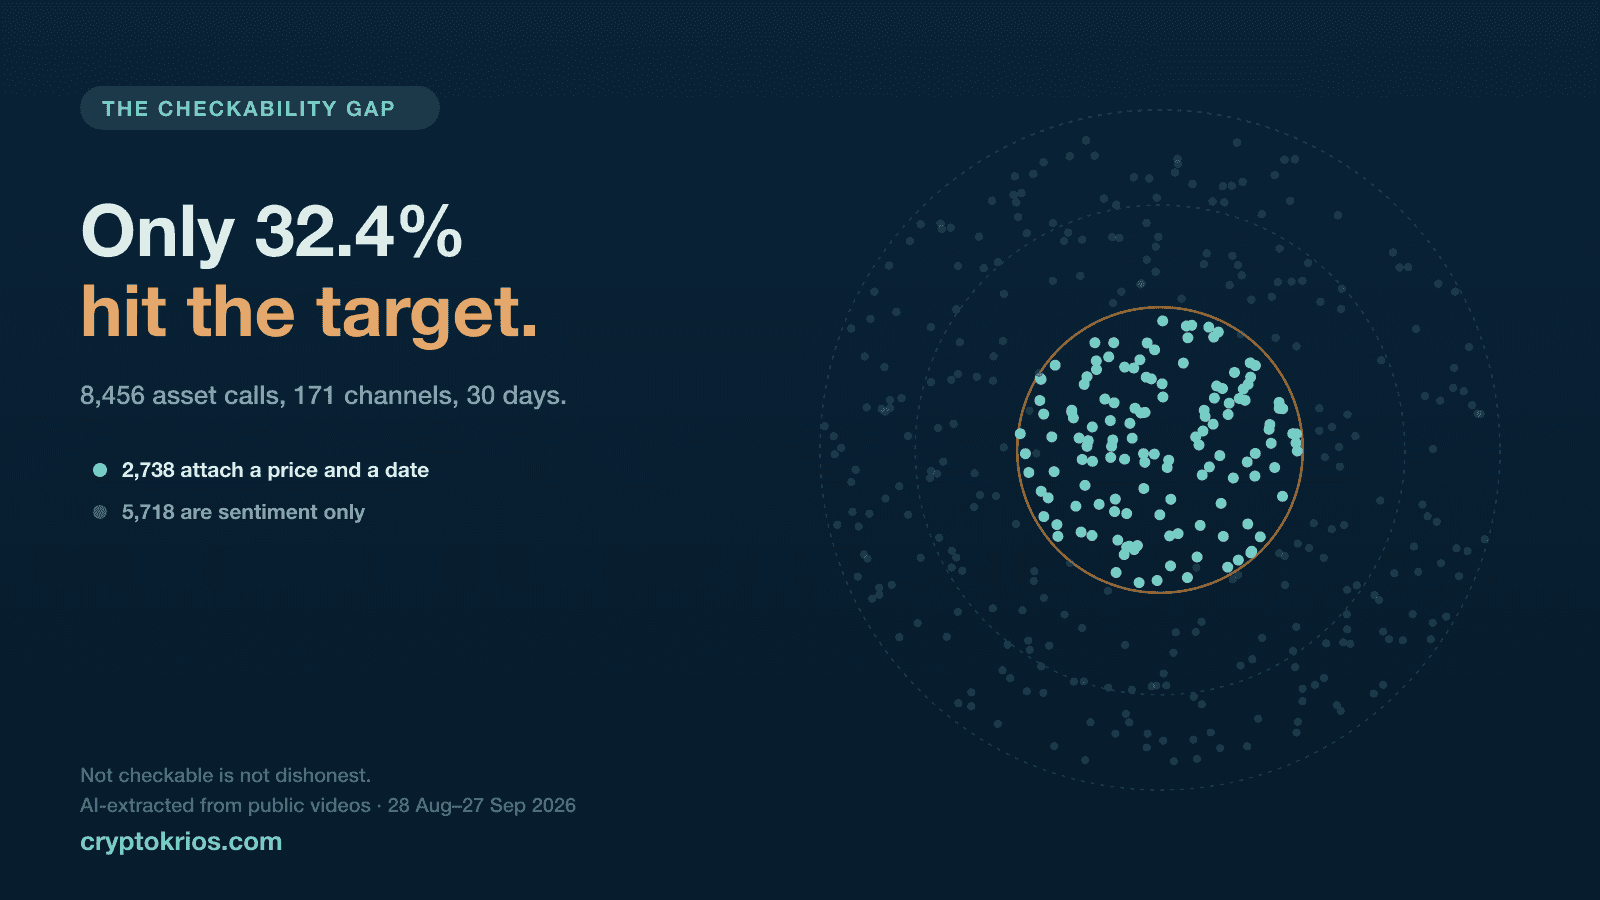
Of 8,456 crypto asset calls in 30 days, only 32.4% attach a target price and a target date — the two things that make a claim checkable. Here's what that gap means, and doesn't.
What 14,330 Judged Crypto Predictions Say About Following Anyone's Calls
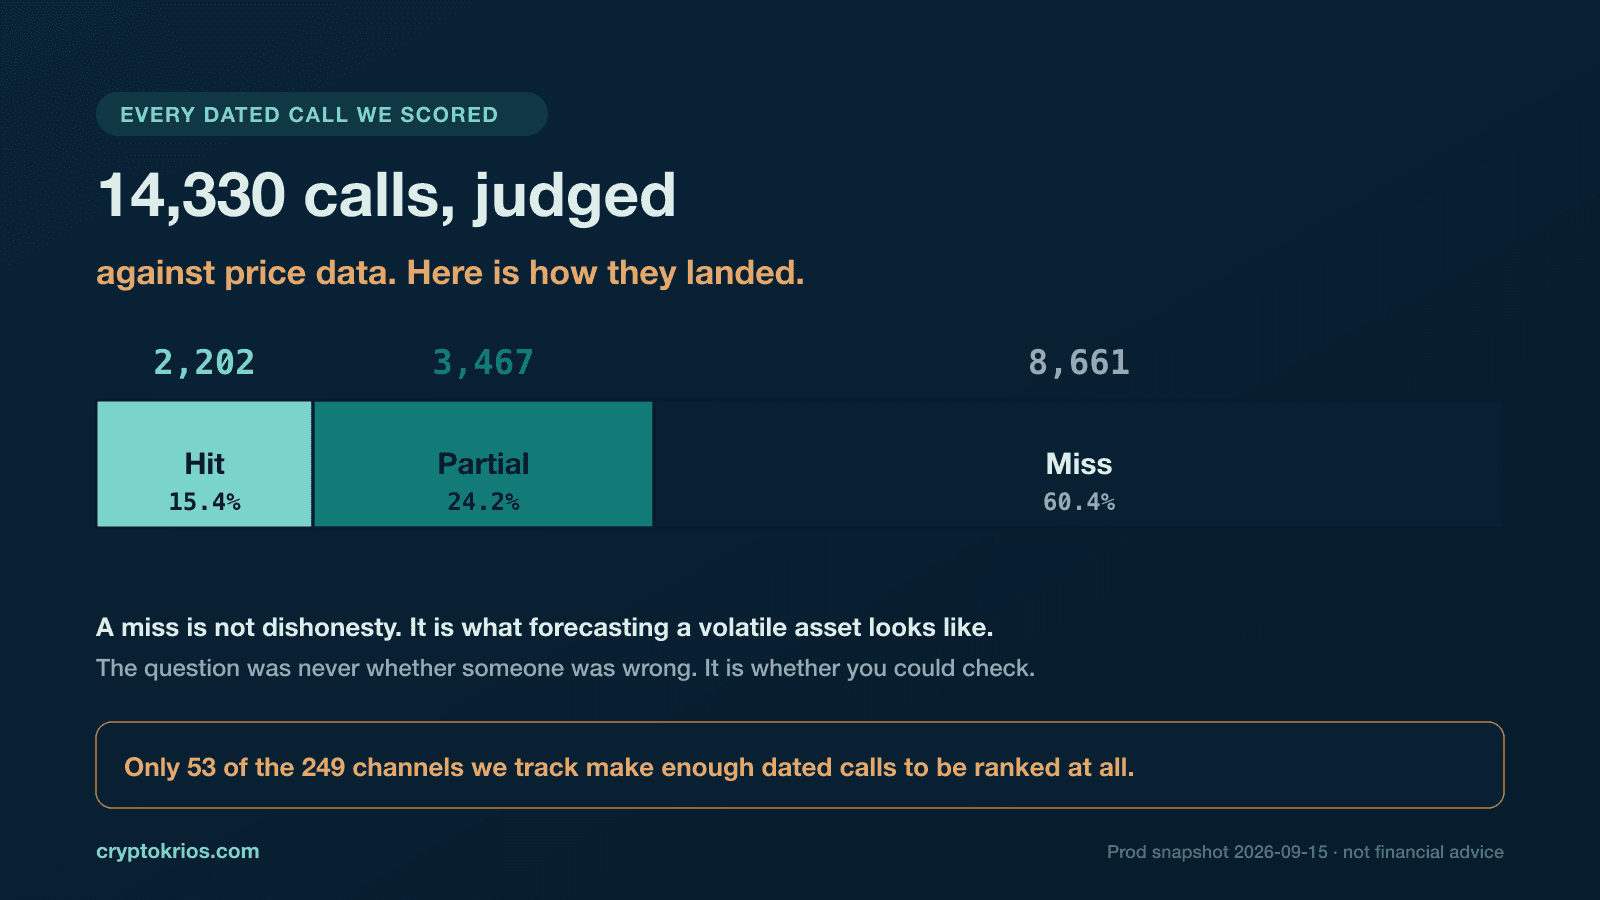
We judged 14,330 crypto predictions against price data. The best creator hits 32.3%—remarkable vs a 15.4% baseline. The real finding: only 53 of 249 channels make enough dated calls to be rankable.