
Crypto Sentiment Indicators Explained (Funding, OI, Liquidations): What They Signal—and What They Don't
Crypto Sentiment Indicators Explained (Funding, OI, Liquidations): What They Signal—and What They Don't
Crypto markets move on narrative, liquidity, and leverage—not just fundamentals. That’s why crypto sentiment indicators like funding rates, open interest (OI), and liquidations are so useful: they show where traders are crowded, overconfident, or getting forced out.
But here’s the catch: crypto sentiment indicators don’t predict direction by themselves. They measure positioning pressure. If you treat them like a “buy/sell” button, you’ll get chopped.
In this guide, we’ll break down funding, OI, and liquidations in plain English—what each indicator signals, what it doesn’t, and how to combine them into a repeatable decision framework. The goal isn’t telling you what to buy. It’s helping you filter hype, spot leverage traps, and assess whether an influencer’s market call is grounded in data.
What “crypto sentiment indicators” really measure (and why traders misread them)
Most people hear “sentiment” and think it means “bullish vs bearish.” In crypto, sentiment is often positioning + leverage + urgency. That’s why the best crypto sentiment indicators are typically derivatives-based. They show how much risk the market is taking and how fragile that positioning is.
At a high level:
- Funding rates measure the cost of holding leverage (and whether longs or shorts are paying).
- Open interest (OI) measures the size of outstanding leveraged positions.
- Liquidations measure forced exits (margin calls), which can accelerate moves.
The most important mindset shift: these indicators are contextual.
A few common misreads:
-
“High funding = price must dump” High positive funding often means longs are crowded, but price can keep grinding up if spot demand absorbs it.
-
“Rising OI = bullish” Rising OI only tells you leverage is increasing. It can fuel a breakout or set up a liquidation cascade.
-
“Big liquidation spike = reversal” Sometimes liquidations mark capitulation and a bounce. Other times they’re just step one in a multi-leg unwind.
So what are crypto sentiment indicators good for?
- Identifying crowded trades (where the pain trade is most likely).
- Measuring leverage temperature (low, medium, high risk).
- Spotting when a move is organic (spot-led) vs fragile (leverage-led).
And what are they not good for?
- Calling tops/bottoms without confirmation.
- Replacing risk management.
- Validating an influencer’s conviction without checking the underlying data.
If you want to use sentiment responsibly, treat it like a dashboard: it tells you how the engine is running, not exactly where the car will go.
Funding rates: what they signal about crowding (and when they lie)
Funding is the periodic payment between longs and shorts in perpetual futures. When funding is positive, longs pay shorts (longs are more aggressive). When funding is negative, shorts pay longs (shorts are more aggressive).
What funding is actually telling you
Funding is one of the clearest crypto sentiment indicators for crowding because it reflects willingness to pay for leverage.
Common interpretations (simplified):
- Strongly positive funding → Longs are crowded, market is “greedy,” upside can be fragile.
- Strongly negative funding → Shorts are crowded, market is “fearful,” downside may be crowded.
- Neutral/low funding → Leverage pressure is lower; moves may be more spot-driven.
A practical way to think about it:
- Funding is like a rent payment for staying in a trade.
- The higher the rent, the more the market is “all-in” on that side.
What funding does not tell you
Funding does not tell you:
- Whether the asset is fundamentally strong.
- Whether spot buyers are stepping in.
- Whether the trend is about to reverse.
This is where people get wrecked: markets can stay irrational longer than leveraged traders can stay solvent.
When funding “lies” (or, more accurately, misleads)
Funding can appear extreme in situations where:
- There’s strong spot demand: price rises and funding stays elevated for days.
- Basis trades and hedging are active: sophisticated desks may use perps vs spot, distorting funding.
- Liquidity is thin: smaller altcoins can show wild funding swings that don’t reflect broader sentiment.
How to use funding safely
Use funding as a risk lens, not a signal:
- If funding is high and rising: reduce leverage, tighten invalidation, avoid late entries.
- If funding flips negative after a drawdown: watch for short crowding and potential squeeze.
- If funding is neutral during a breakout: that’s often healthier than a breakout fueled by expensive leverage.
Actionable checklist:
- Compare funding across exchanges (Binance, OKX, Bybit). Consistency matters.
- Pair funding with OI direction (next section). Funding without OI is incomplete.
- Look for divergences: price up, funding down can imply less crowded continuation.
If an influencer posts “funding is high so short now,” ask: high relative to what timeframe? Is OI climbing? Is spot volume leading? Funding alone is not a trade.
Open interest (OI): why it’s the best leverage thermometer (but not a direction tool)
Open interest is the total number (or notional value) of outstanding derivative contracts that haven’t been closed. Rising OI means new positions are opening. Falling OI means positions are closing.
OI is one of the most powerful crypto sentiment indicators because it tells you when the market is adding leverage exposure.
What rising or falling OI usually means
Interpret OI with price:
- Price up + OI up → Leverage is chasing the move. Could be trend continuation or a crowded long setup.
- Price down + OI up → Shorts are pressing (or longs are averaging down). Volatility risk rises.
- Price up + OI down → Short covering / deleveraging rally. Often more “stable” than leverage-led pumps.
- Price down + OI down → Longs capitulating / deleveraging. Can precede a base, but not guaranteed.
The key is that OI is a measure of participation and fragility.
What OI does not tell you
OI does not tell you:
- Whether the new positions are longs or shorts.
- Whether they’re hedges or directional bets.
- Whether smart money or retail is driving the flow.
That’s why OI must be combined with:
- Funding (to infer long vs short pressure)
- Liquidations (to see forced positioning changes)
- Spot volume / order flow (to detect organic demand)
A data-driven way to read OI like a pro
Think in regimes rather than single readings:
-
Healthy trend regime
- Price climbs, OI grows slowly, funding moderate.
- Liquidations stay contained.
-
Leverage-overheat regime
- Price climbs, OI spikes, funding expands.
- Small dips trigger long liquidations.
-
Deleveraging regime
- OI collapses quickly, liquidations spike.
- Funding often snaps toward neutral.
A helpful heuristic:
- Fast OI expansion is more dangerous than slow OI expansion.
- OI at local highs increases the probability of a squeeze (either direction).
How to use OI in practice
Action steps for investors (not day traders):
- When OI is rising aggressively, treat it as a “fragility alert.” Size smaller.
- Prefer entries after partial deleveraging (OI cools off) rather than peak crowding.
- Use OI as a filter for influencer calls: if someone posts “easy breakout” while OI is already stretched and funding is hot, you’re likely late.
The value of OI is simple: it tells you when the market is building a spring. But it doesn’t tell you which way it will snap.
Liquidations: forced selling/buying that creates cascades (and fake “capitulation” signals)
Liquidations happen when leveraged positions can’t meet margin requirements. Exchanges forcibly close them, which becomes market orders that push price further—often triggering more liquidations.
Liquidations are among the most dramatic crypto sentiment indicators because they visualize pain: who got forced out, how hard, and how fast.
What liquidation spikes usually signal
Liquidations can mean:
- Cascades: one move triggers forced exits, accelerating momentum.
- Stop runs: price hunts liquidity pockets, wipes one side, then reverses.
- Leverage flushes: the market resets positioning, sometimes setting up cleaner price action.
Common patterns:
- Long liquidation spike after an extended rally → leverage unwind; could be a dip-buying opportunity or trend break.
- Short liquidation spike during a breakout → squeeze; can extend further if spot follows.
- Repeated liquidation waves → unstable market structure, high risk of whipsaw.
What liquidations do not tell you
Liquidations don’t automatically mean “capitulation.” A big red liquidation print looks like a bottom, but without follow-through it can be a trap.
Liquidation data also has limitations:
- It’s often exchange-specific.
- It can be aggregated differently by data providers.
- Not all forced flows are captured equally (some liquidations are internalized).
How to use liquidation data without getting baited
Use liquidations as confirmation of a leverage reset, not a stand-alone reversal call.
A practical framework:
-
Identify which side got hit
- Mostly long liquidations? The market flushed optimistic leverage.
- Mostly short liquidations? The market punished bearish crowding.
-
Check OI response
- If liquidations spike and OI drops sharply, leverage actually exited (cleaner).
- If liquidations spike but OI stays high, leverage may be reloading (still dangerous).
-
Check funding response
- If funding was extreme and snaps back toward neutral, the flush likely relieved pressure.
-
Watch spot behavior
- Strong spot bids after a long liquidation event is more constructive than a bounce fueled only by perps.
Investor takeaway: liquidation charts are the “crime scene tape.” Useful, but only if you also investigate what changed in positioning afterward.
Putting it together: a simple “sentiment stack” to avoid leverage traps (and evaluate influencer claims)
If you only remember one thing: no single sentiment metric is enough. The edge comes from stacking crypto sentiment indicators to infer positioning risk.
Here’s a simple, repeatable “sentiment stack” you can run in 3–5 minutes before acting on a market narrative.
Step 1: Start with the leverage temperature
- Funding: neutral / warm / hot
- OI: stable / rising / spiking
Interpretation:
- Hot funding + spiking OI = crowded leverage. High squeeze risk.
- Neutral funding + stable OI = less crowded. Moves may be cleaner.
- Negative funding + rising OI = shorts pressing. Watch for squeeze catalysts.
Step 2: Identify the most likely “pain trade”
Markets often move toward maximum discomfort.
- If everyone is long (high funding, high OI), the pain trade is a sharp dip.
- If everyone is short (negative funding, rising OI), the pain trade is a squeeze.
This doesn’t tell you timing. It tells you where fragility lives.
Step 3: Use liquidations as the trigger confirmation
Liquidations are the “event.” You’re looking for:
- A flush that reduces OI meaningfully
- Funding cooling off
- Price stabilizing with spot support
If liquidations spike but OI stays elevated and funding stays extreme, the market may not be done unwinding.
Step 4: Add one non-derivatives sanity check
Derivatives show leverage, but spot confirms demand.
Pick at least one:
- Spot volume expanding on breakouts
- Order book support holding after flushes
- On-chain exchange inflows/outflows (context-dependent)
How this helps you evaluate crypto influencers (the CryptoKrios angle)
Most influencer “sentiment” takes are one-liners:
- “Funding is crazy, dump soon.”
- “OI is rising, bulls are back.”
- “Liquidations printed, bottom is in.”
With the sentiment stack, you can audit those claims quickly:
- Did they specify timeframe and benchmark for “crazy” funding?
- Did they show OI relative to recent highs (not just today’s number)?
- Did liquidations lead to real deleveraging (OI down) or just volatility?
At CryptoKrios, this is exactly what we score: who consistently backs calls with context, and who posts engagement bait. “Data, not hype” isn’t a slogan—it’s a measurable behavior.
Conclusion: use crypto sentiment indicators to manage risk, not to chase signals
Funding, OI, and liquidations are the core crypto sentiment indicators because they expose leverage—and leverage is what turns normal moves into violent moves. Used correctly, they help you avoid late entries, reduce the odds of getting caught in cascades, and sanity-check influencer narratives.
Used incorrectly, they become another form of hopium: a single metric you cherry-pick to justify what you already want to believe.
If you want to follow crypto content creators with more confidence, CryptoKrios helps you validate who’s worth listening to using explainable trust scoring, prediction tracking, and bias detection.
Try CryptoKrios for free and start filtering signal from noise: https://cryptokrios.com/auth/login
Discover what crypto influencers really say
Get AI-verified analysis of top crypto content creators — free.
Try CryptoKrios FreeRelated Articles
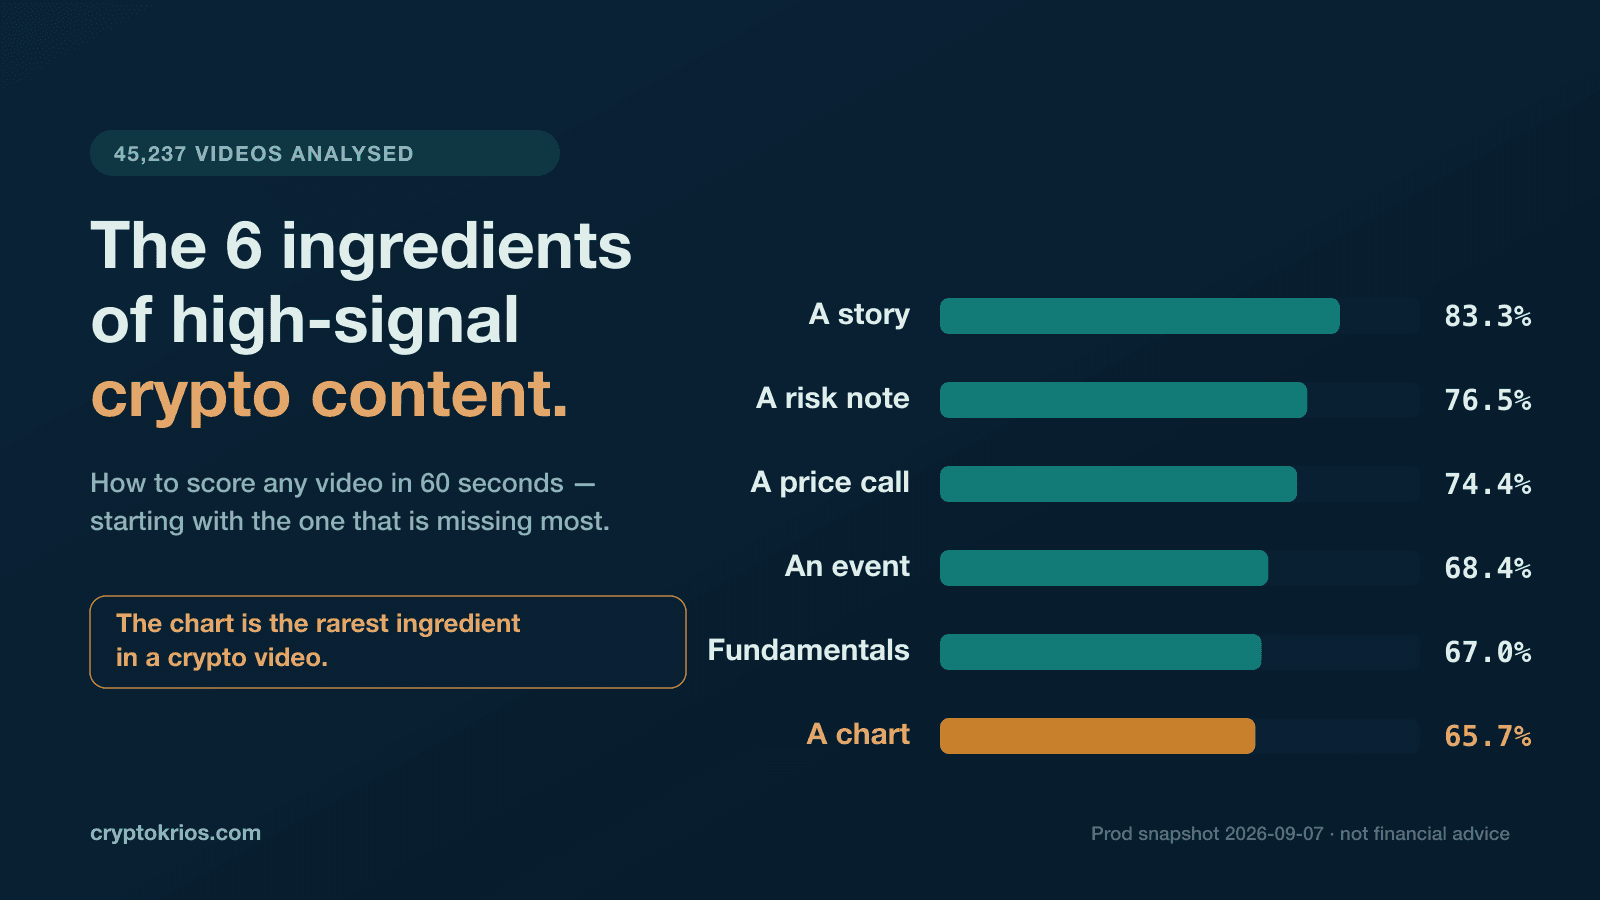
Crypto Content Checklist: The 6 Ingredients of High-Signal Crypto Content (And How to Score a Video in 60 Seconds)
A crypto content checklist you can run in 60 seconds. Learn the 6 ingredients of high-signal crypto videos, backed by analysis of 45,237 videos, plus a simple scoring framework to filter hype fast.
No Number, No Date, No Score: What a Crypto Prediction Target Date Actually Changes
Of 15,090 tracked crypto predictions with no target price, zero have ever been verified — even the ones that carried a date. Using the CryptoKrios database (2026-08-26), we measure what a target price and a target date each actually change, and give you a ten-second audit.

Crypto Creator Correction Policy: A Transparent Template for Updating Forecasts (Without Rewriting History)
A crypto creator correction policy makes forecasts auditable: preserve originals, timestamp revisions, and publish final verdicts. Use this template and checklist to separate transparent analysis from hindsight edits.

Crypto Influencer Due Diligence Checklist (2026): A Practical, Data-Driven Guide for Retail Investors
This crypto influencer due diligence checklist helps retail investors verify claims, assess track records, and spot bias in 2026. Built with real creator-claim data (33,921 tracked claims) and a repeatable scoring system you can use weekly.