Story vs Charts in Crypto YouTube: When Narrative Helps (and When It Replaces Analysis)
Story vs Charts in Crypto YouTube: When Narrative Helps (and When It Replaces Analysis)
Crypto YouTube runs on stories. But investing runs on evidence. In this article we use CryptoKrios’ 2026-09-07/09 production snapshot (45,237 YouTube videos with completed AI analysis) to separate helpful narrative from analysis-shaped entertainment—and to show where crypto YouTube technical analysis actually shows up (and where it doesn’t).
Here’s the core tension: narrative isn’t the enemy. Humans use stories to hold a thesis in their head. The problem is when narrative substitutes for evidence, especially in videos that feel convincing but never touch a chart, invalidation level, or risk plan.
We’ll quantify the pattern, then give you a simple, fair “story quality test” you can apply in under 60 seconds—without needing to become a full-time trader.
The dataset reality: narrative dominates, crypto YouTube technical analysis is rarer than you think
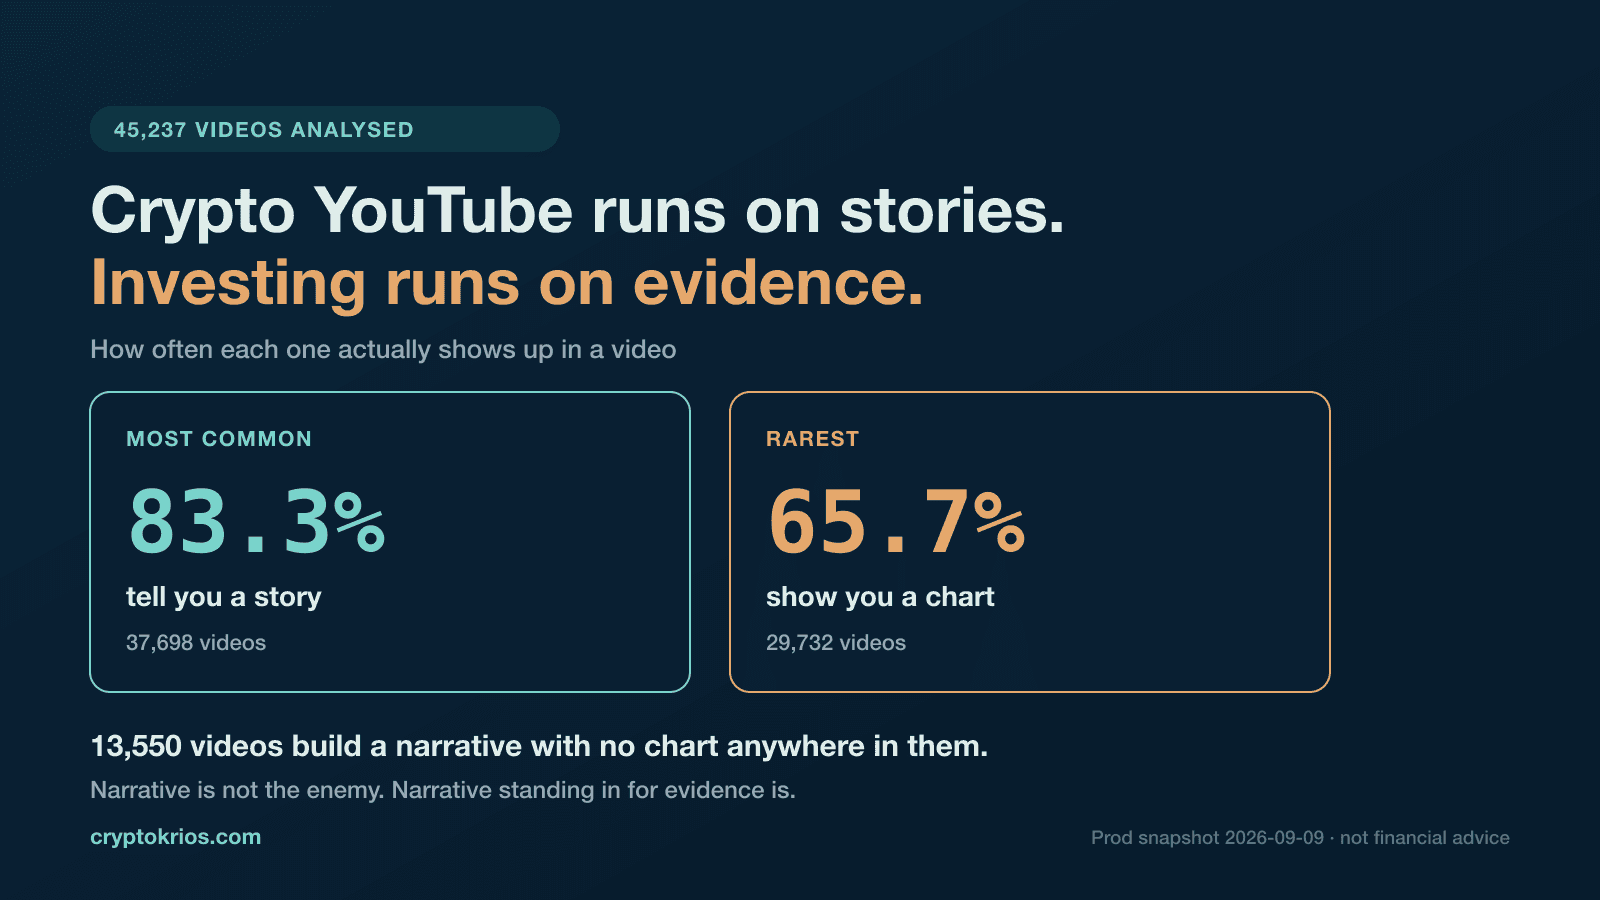
CryptoKrios analyzed 45,237 YouTube videos end-to-end. We tag common “ingredients” creators use to build a thesis. One result surprised even us: a narrative/story appears in 37,698 videos (83.3%), making it the most common ingredient across the platform.
Now compare that to charts.
Technical analysis (a chart) appears in 29,732 videos (65.7%)—the rarest ingredient in this snapshot. That matters, because “analysis” is often implied by tone, confidence, and production quality, not by actual technical analysis on-screen.
Here’s how the other ingredients show up (and how often videos add structure beyond the story):
- Risk section: 34,617 (76.5%)
- Price call (explicit target/level): 33,644 (74.4%)
- Event angle (news/catalyst framing): 30,937 (68.4%)
- Fundamentals: 30,326 (67.0%)
Two patterns are important if you’re trying to judge influencer quality:
-
Narrative is the default. Most creators are storytelling first, analysis second.
-
Many videos are incomplete “thesis stacks.” Only 14,206 videos (31.4%) include the full combo of chart + fundamentals + risk + call. The other 31,031 are missing at least one piece.
And there’s a third pattern that explains why so many viewers feel “informed” but still get wrecked:
- 13,550 videos (29.9%) contain a narrative with NO technical analysis at all.
That’s not automatically “bad content.” Some macro or fundamental theses don’t require candle-by-candle TA. But when a video is positioned like a trade thesis—and the only support is a compelling storyline—it becomes hard to separate signal from persuasion.
Takeaway: In crypto YouTube, story is common; technical analysis is not. If you assume “every serious video has charts,” the data says otherwise.
Do charts correlate with better outcomes? Yes—BUT don’t confuse correlation with causation
CryptoKrios tracks outcomes on verified calls only, joined back to the parent video. This is crucial: we are not scoring vibes. We’re checking whether a specific call later “lands” or not.
First comparison: videos with a chart vs without a chart.
- With a chart: 15.7% land (1,615 of 10,294)
- Without a chart: 7.3% land (37 of 504) — note the sample size is small
That’s a meaningful gap in hit rate. But we need to be precise about what we can and cannot claim:
- We cannot say charts cause better calls.
- We can say that calls made in videos containing a chart are associated with a higher verified land rate in this snapshot.
Why might that association exist (without claiming causation)? A few plausible, non-mutually-exclusive explanations:
- Creators who bother to show charts may also be more disciplined about entries and exits.
- A chart forces specificity (levels, invalidation), which makes “calls” more testable.
- Chart-based videos may naturally include more complete thesis elements (risk, levels).
Now look at “thesis stack completeness.” When a video includes chart + fundamentals + risk, outcomes improve modestly:
- Full stack (chart + fundamentals + risk): 16.5% land (806 of 4,877)
- Anything less: 14.3% land (846 of 5,921)
- Spread: +2.2 percentage points
That is not a victory lap. Even the best bucket—16.5%—is a losing number in most trading contexts. It tells you something uncomfortable but valuable:
- Crypto YouTube is not a signal machine.
- Your edge comes from filtering, position sizing, and not outsourcing conviction to content.
For extra context, CryptoKrios’ overall strict hit rate is about ~15.3% across ~36,500 tracked calls in this snapshot.
Takeaway: Videos that include technical analysis correlate with higher verified land rates, but (1) the no-chart comparison set is small (504), and (2) even the “best” bucket is still low. Use this as a filtering signal, not as permission to ape.
Risk talk matters (a bit): what the “risk section” correlates with—and what it doesn’t fix
Creators love confidence. Markets love humility. A “risk section” is one of the simplest ways to detect whether a creator is thinking probabilistically or selling certainty.
In the snapshot:
- Risk section appears in 34,617 videos (76.5%).
When we look at verified outcomes:
- Risk named: 15.7% hit, 59.2% outright miss (across 8,718 verified calls)
- No risk named: 13.6% hit, 65.0% outright miss (across 2,080 verified calls)
Two notes here:
-
The hit-rate difference is real but not magical. Risk disclosure doesn’t transform a weak thesis into a strong one.
-
Risk framing helps you as a viewer even when the call misses. Why? Because it gives you a plan for “what would make this wrong” and how much downside is acceptable.
So how do you tell if a “risk section” is substance or theater?
A practical checklist for real risk (not disclaimer fluff)
A legitimate risk section usually includes at least two of the following:
- Invalidation level (a price level where the thesis is wrong)
- Conditions, not platitudes (“If BTC loses X support on high volume” beats “Markets are volatile”)
- Position sizing guidance (even broad: “small size,” “no leverage,” “scale in”)—not financial advice, but risk framing
- Time-based risk (what if nothing happens by a certain date?)
If the creator says “not financial advice” and moves on, that is not risk management. It’s legal hygiene.
Where technical analysis helps: charts make invalidation easier to express. A horizontal level, trendline break, or structure shift can become a clear “I’m wrong if…” statement.
Takeaway: Risk discussion correlates with slightly better outcomes and notably fewer outright misses, but the bigger value is that it turns a story into a testable plan.
The Story Quality Test: when narrative does legitimate work vs when it replaces analysis
Narrative is how humans compress complexity. In crypto, it helps viewers remember a thesis, connect catalysts, and understand market psychology. That’s why it shows up in 83.3% of videos.
But the dataset also shows a warning label: 13,550 videos (29.9%) carry a narrative with no technical analysis. That cluster is where “the story becomes the product.”
Use this fair test to decide whether a story is doing legitimate work.
A good narrative does 3 jobs
- Names a mechanism (the “because”)
- Good: “If liquidity rotates from majors to high-beta L1s, this asset tends to outperform.”
- Weak: “This coin is about to explode because the community is strong.”
Mechanism means you can argue it. If you can’t argue it, you can’t validate it.
- Defines a catalyst with a timeframe (the “when”)
- Good: “Between now and the next FOMC / ETF decision / token unlock window, watch for X.”
- Weak: “Soon” / “this cycle” / “any day now.”
Timeframes force accountability. Without time, a story can never be wrong—only “early.”
- States falsification (the “how this fails”)
This is the part most narrative-heavy videos skip.
- Good: “If BTC breaks below X and dominance spikes, this thesis is invalid.”
- Weak: “Worst case, we consolidate and then go higher.”
Falsification is where narrative becomes analysis. And it’s where technical analysis can add clarity, because a chart can anchor the “wrongness” to a level.
Red flags that the story is replacing analysis
These are common narrative patterns that feel analytical but aren’t:
- No levels, only adjectives: “massive,” “insane,” “parabolic,” “inevitable.”
- Single-cause explanations: “It pumped because whales.” (Maybe—but show evidence.)
- Unfalsifiable claims: “Smart money is accumulating.” (How would we know you’re wrong?)
- Retrofitted certainty: “We all knew this would happen.” (Then where was the invalidation?)
The 60-second viewer workflow
Before you take any action from a video, ask:
- What is the claim (in one sentence)?
- What evidence supports it (chart, fundamentals, on-chain, macro)?
- What is the invalidation (price/time/condition)?
- What is the risk plan if wrong?
If you can’t answer these, you’re not consuming technical analysis—you’re consuming a compelling narrative.
Takeaway: Narrative is useful when it specifies mechanism, timeframe, and falsification. It’s harmful when it’s just confidence without testable claims.
How to watch technical analysis without getting sold a storyline
You don’t need to become a chart wizard. You need a repeatable way to filter creators and videos that convert attention into decisions.
Based on the snapshot, most videos include some of these ingredients—story, risk, calls, fundamentals—but only 31.4% show the full “complete” stack (chart + fundamentals + risk + call). That means your default assumption should be: something is missing.
Here’s a simple approach to upgrade your viewing.
1) Demand specificity from charts
A chart on screen is not automatically technical analysis. It becomes analysis when it includes:
- A level that matters (support/resistance/invalidation)
- A scenario (if/then)
- A plan (entry concept + risk boundary)
If the chart is used as a backdrop while the creator tells a story, treat it like set decoration.
2) Separate “market commentary” from “trade thesis”
Commentary can be helpful without precise levels. A trade thesis should be measurable.
If the creator gives a price call (and 74.4% of videos do: 33,644), ask whether it’s anchored:
- Anchored: “Above X, targeting Y, invalid below Z.”
- Floating: “Target is Y because I feel it’s undervalued.”
3) Look for stacking, not single-factor conviction
The data suggests small but consistent improvements as videos stack components (chart + fundamentals + risk). The edge isn’t one magic indicator—it’s completeness.
A healthy “stack” might look like:
- Catalyst: what changes (and when)
- Fundamentals: why the asset matters
- Chart: where the market proves/disproves it
- Risk: how you limit downside
When one leg is missing, the story carries too much weight.
4) Remember the baseline: even the best bucket is still low
This is the sobering part. In verified calls:
- Full stack (chart + fundamentals + risk) lands 16.5% (806 of 4,877)
- Overall strict hit rate sits around ~15.3% across ~36,500 tracked calls
So don’t treat technical analysis like a prediction engine. Treat it like hypothesis generation. Your job is validation, sizing, and not confusing persuasion with probability.
Takeaway: Watch for testable levels, anchored calls, and stacked evidence. Use videos to generate ideas, not to outsource conviction.
Conclusion: keep the story, demand the evidence
Narrative is everywhere on crypto YouTube—83.3% of analyzed videos use it. That’s not a flaw; it’s how humans reason. The issue is when narrative replaces technical analysis and testable evidence, especially in the 29.9% of videos that tell a story with no chart at all.
If you remember one rule: a legitimate story names a mechanism, a catalyst with a timeframe, and what would falsify it. Everything else is entertainment.
Want to filter creators and videos faster, with transparent metrics? Create a free CryptoKrios account and start analyzing influencer content with explainable trust signals and tracked outcomes: https://cryptokrios.com/auth/login
Discover what crypto influencers really say
Get AI-verified analysis of top crypto content creators — free.
Try CryptoKrios FreeRelated Articles
How We Score a Crypto YouTuber: The 13 Indicators Behind a Trust Score
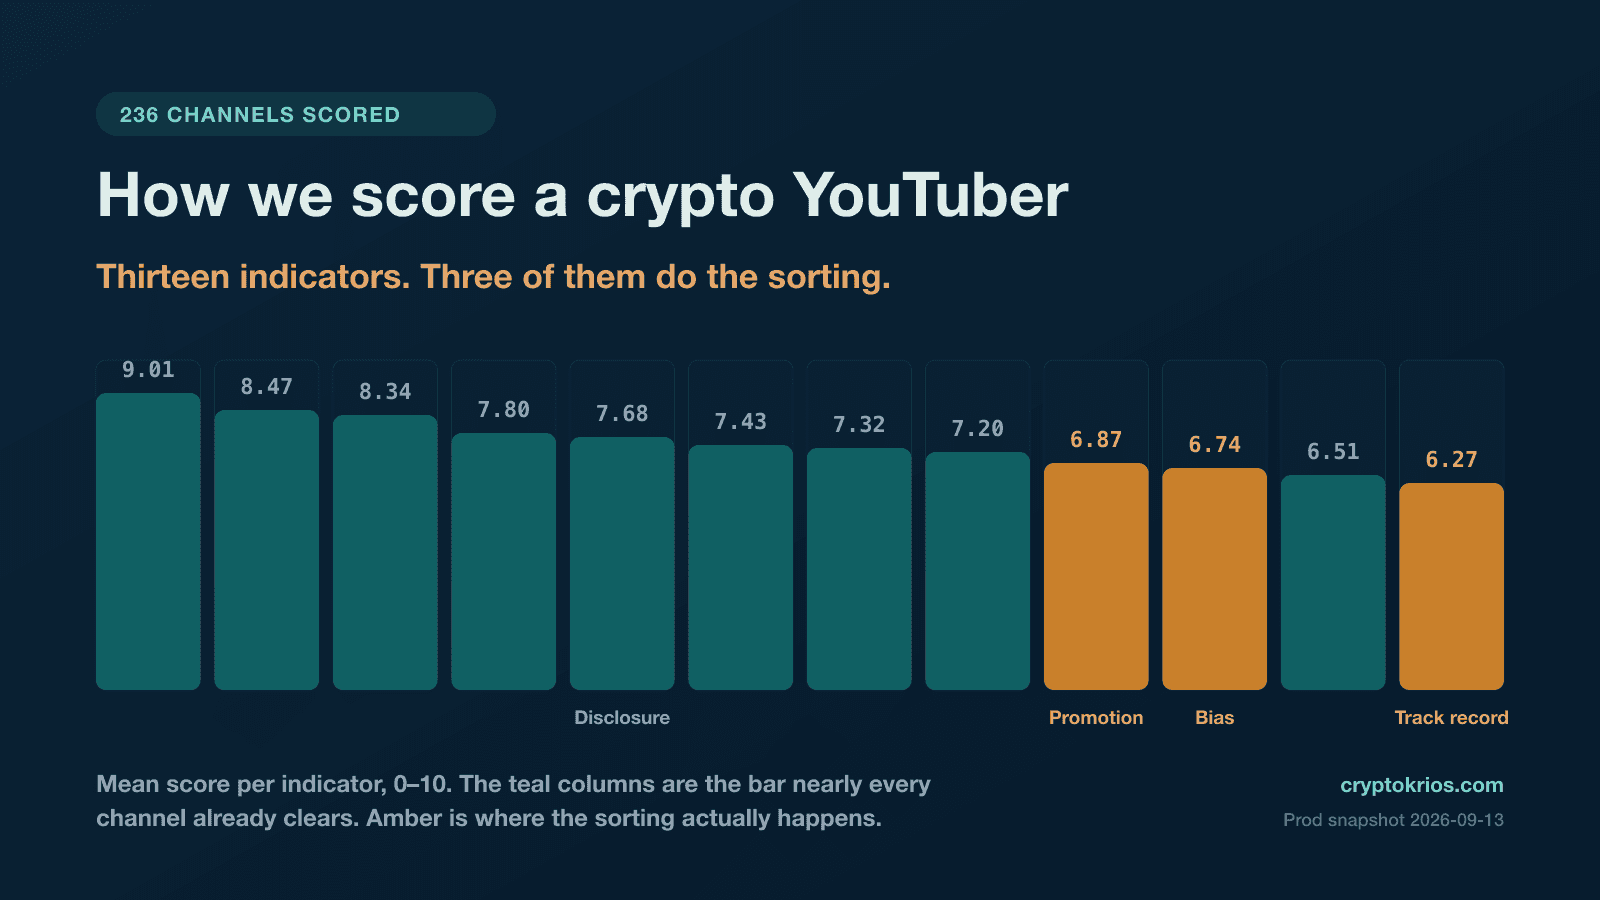
A crypto youtuber trust score shouldn’t be a vibe check. This guide breaks down CryptoKrios’ 13 indicators (with verified platform averages) and explains what the score means, what it doesn’t, and how to use it responsibly.

The Partial Crypto Prediction Playbook: How Grey-Zone Calls Become “Wins” (and How to Audit Them)
A partial crypto prediction means the direction was right but the target price was wrong. Using CryptoKrios data (2026-08-24), we show how partials get marketed as wins—and a practical audit you can apply to any creator.

Crypto Influencer Sponsorship Disclosure: Sponsored vs Organic Crypto Content (A Practical Bias Checklist + Examples)
A practical, example-driven crypto influencer sponsorship disclosure checklist to spot sponsored bias fast. Includes red-flag vs responsible wording, what disclosures miss, a 2-minute verification protocol, and a before/after script rewrite.

Crypto Influencer Bias Detection: 7 Content Patterns That Correlate With Low Accuracy
Crypto influencer bias detection helps you separate analysis from incentives. Learn 7 bias patterns that correlate with lower accuracy—and the self-checks you can run to vet any creator fast.